MY CODE
My Code (serious stuff 🔬)
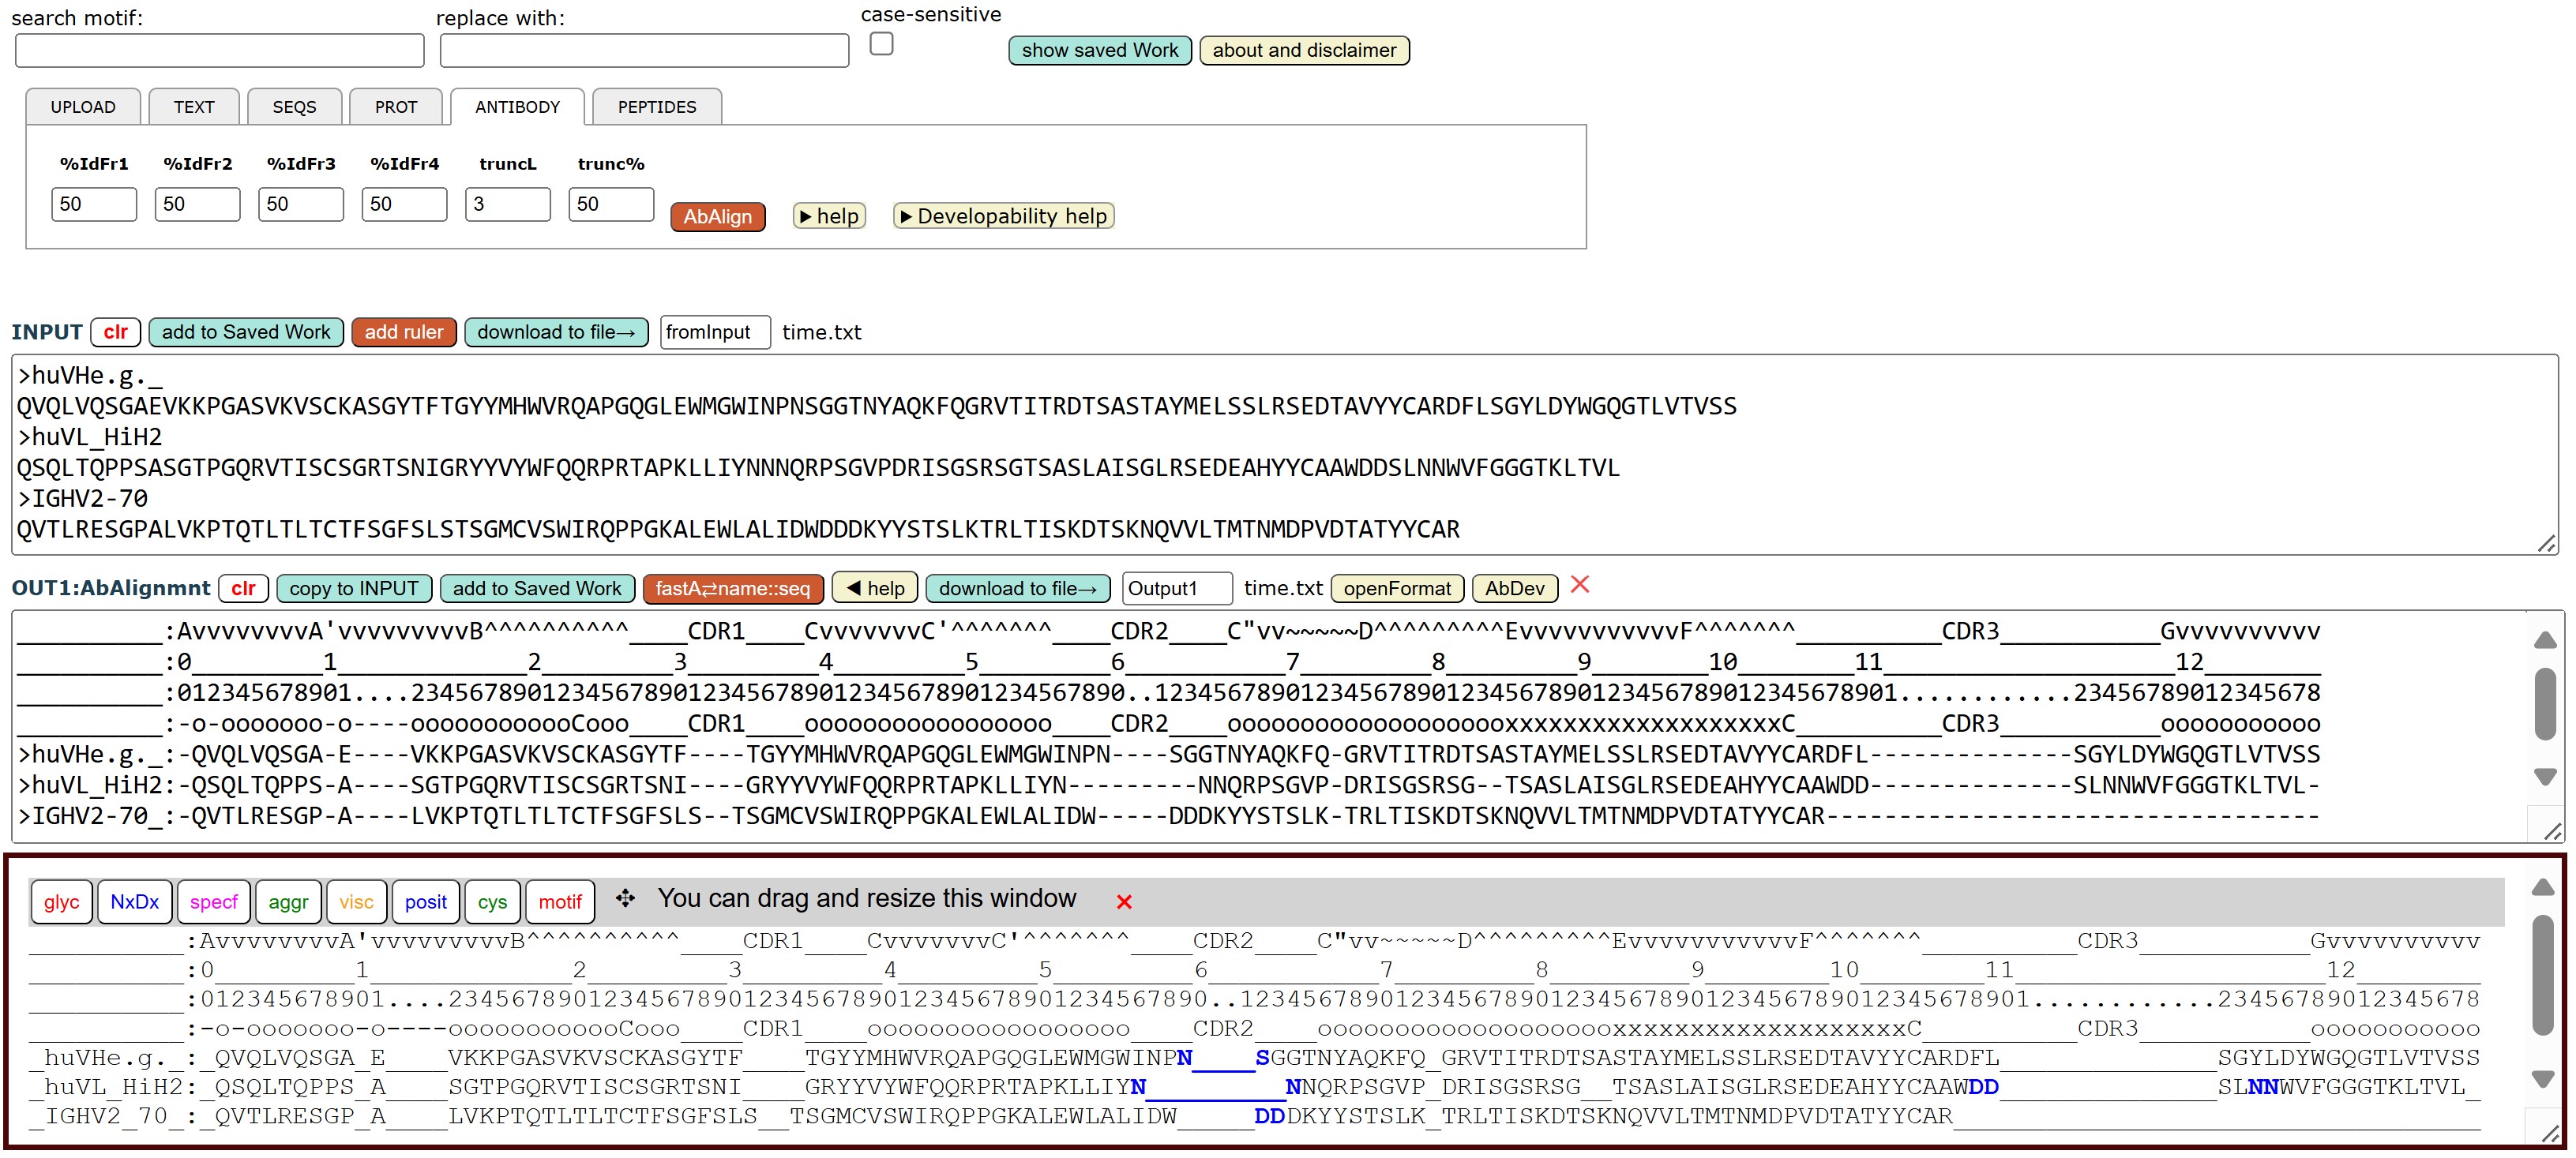
MolBioWiz BATCH DNA AND PROTEIN SEQUENCE ANALYSIS
MolBioWiz can process up to thousands of DNA or protein sequences at once, for
sequence formatting, translation, reverse-complementing, reverse-transcription, and motif searches.
It can also help design peptide immunogens, do multiple antibody V-region
sequence alignments and find antibody developability problems as shown in the figure below.


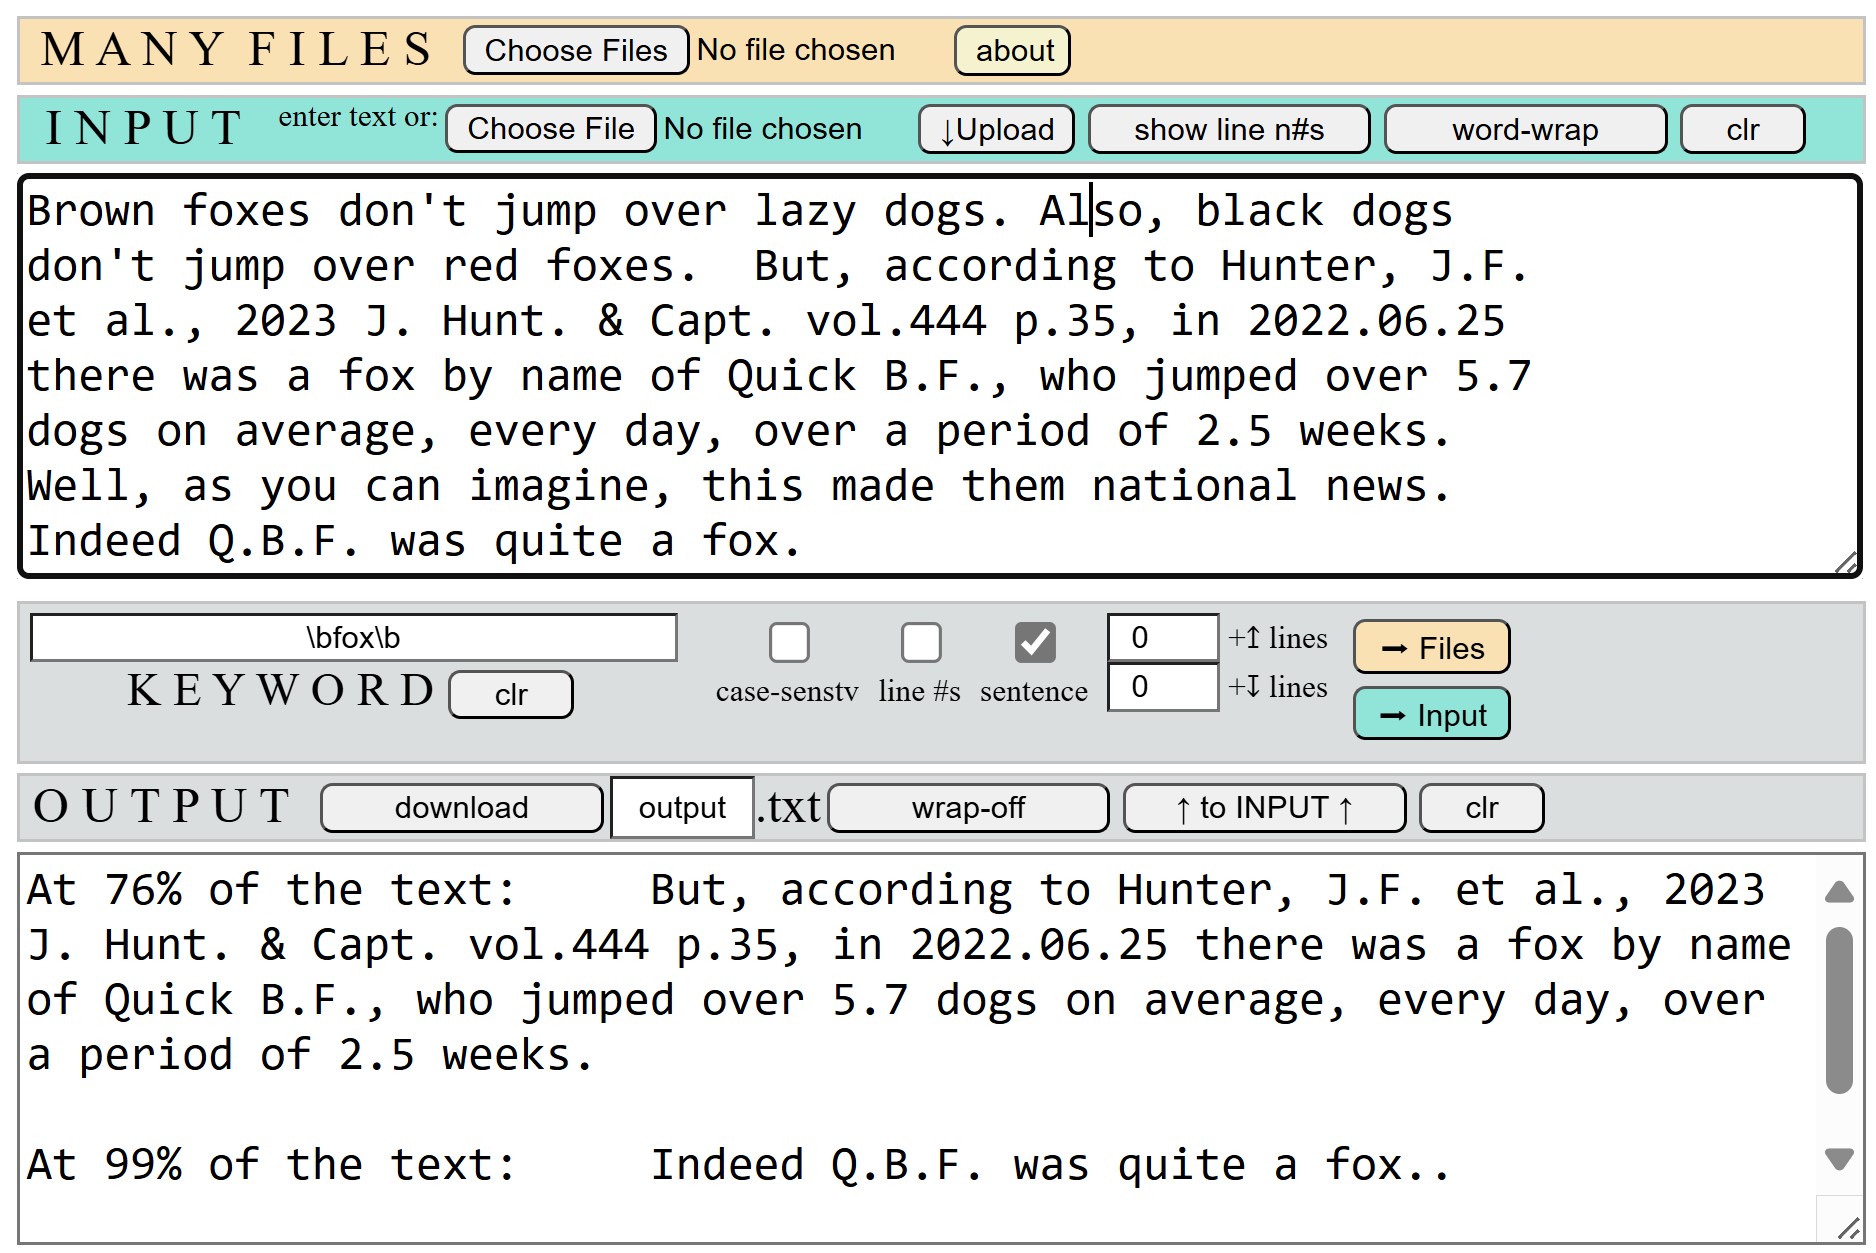
TET BATCH TEXT FILE TEXT EXTRACTION TOOL
Text Extraction Tool, finds and extracts lines containing
a keyword and optionally, additional lines above and/or below it. It can also extract
sentences even if they span several lines. The input is either a list
of up to hundreds of text files, or text uploaded, pasted, or entered into the INPUT area.
You can use a regex expression as a KEYWORD (google "js regex" to learn more).
PDF and Microsoft Word files ARE NOT text files (but, see my next two batch file conversion programs).
Examples of text files are .txt, .text, .csv, and many programming and data files.


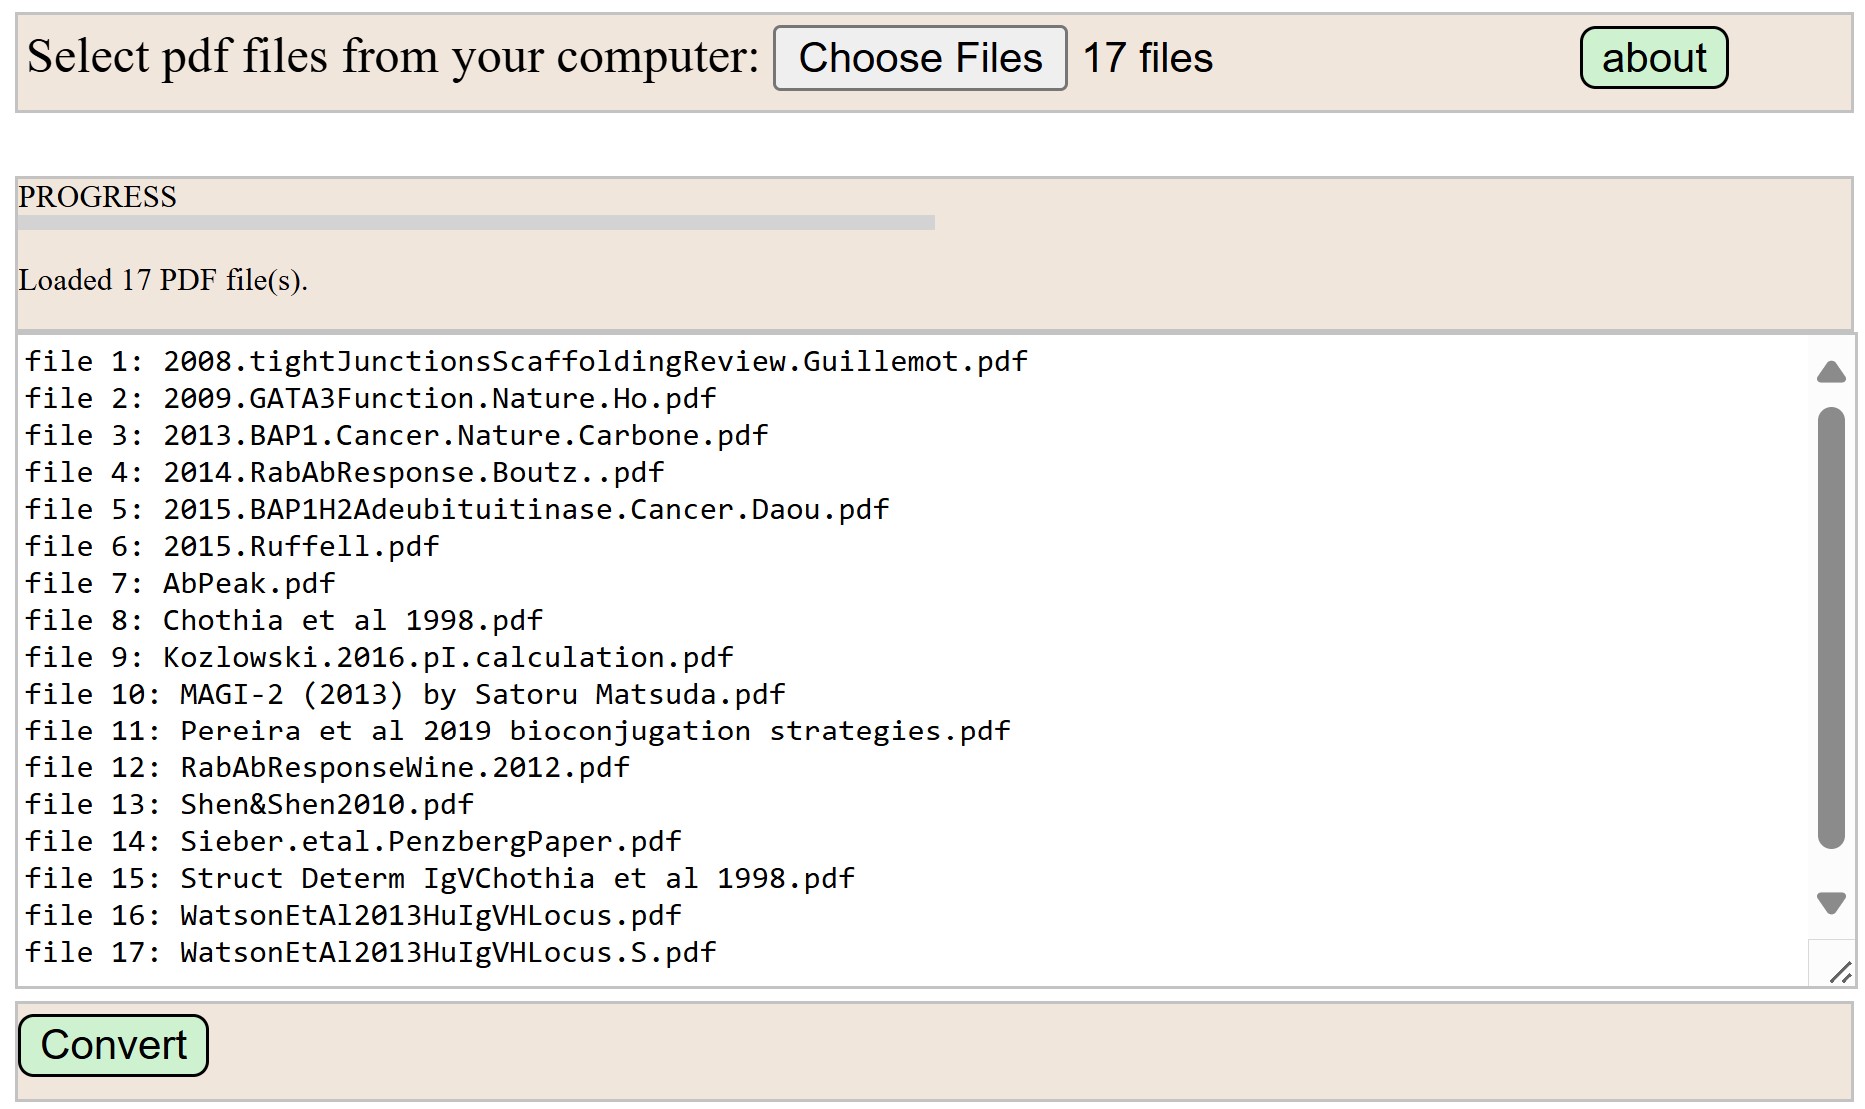
PDF→Text and MSWORD→Text BATCH FILE CONVERSION PROGRAMS
These two programs use the public libraries (pdf.min.js, pdf.worker.min.js, for pdf, jszip.min.js for word
and FileSaver.min.js for both), to convert a list of up to hundreds of pdf or word files to text files.
The programs will split the original content into "perceived" sentences. While the loss of page formatting
and the occasional misinterpretation of characters, will make it difficult to read the converted
files, the text will be searchable and can be mined using the TET program. The User
interfaces are identical except for the background color.


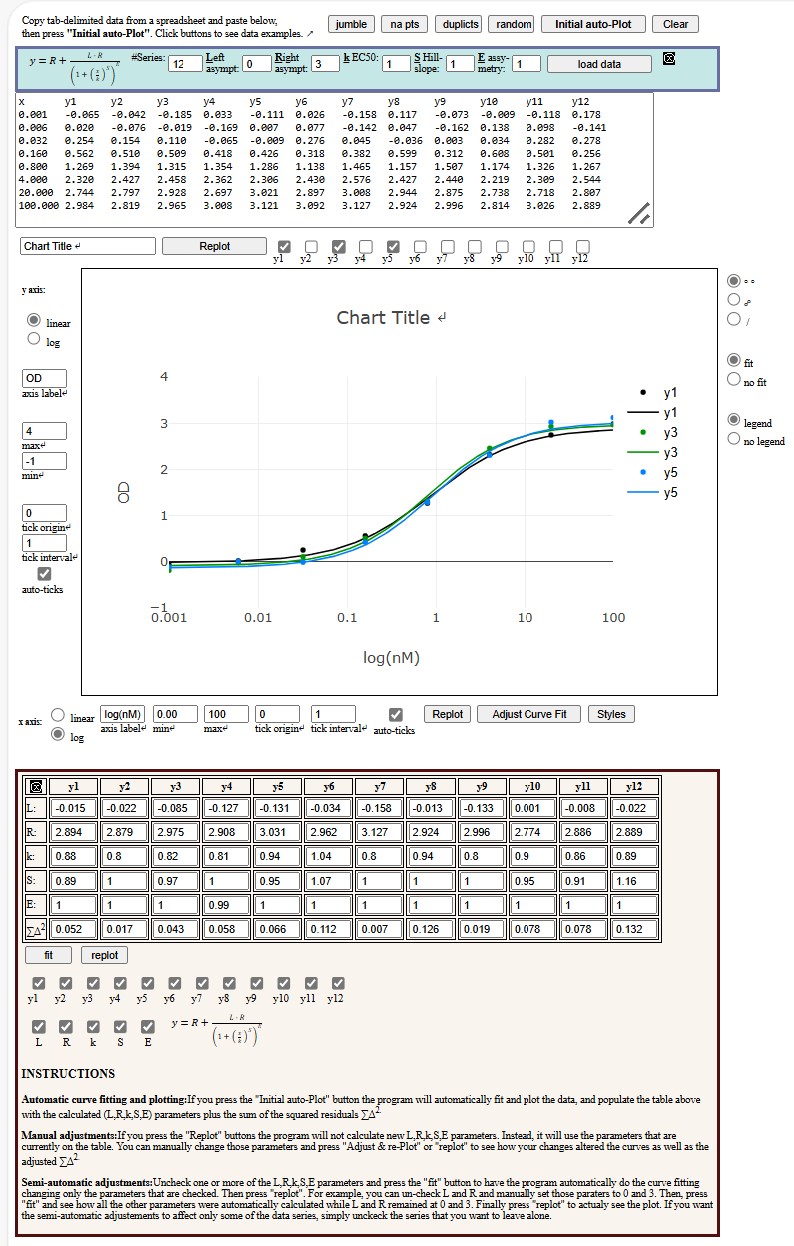
abPlot FITTING ANTIBODY BINDING DATA TO LOG LOGISTIC FUNCTIONS
This program will fit antibody binding data to a log-logistic function of up to 5 parameters,
and plot the data and the fit. Ideally, the data should be coppied and pasted from a spreadsheet.
The first column contains the antibody or ligand concentrations (x). You can have up to 12
(y1 - y12) columns of readings. You may have repeated x concentrations and omit or duplicate
some of the y readings. While I prefer to use Python for plotting pretty charts this program
allows me to manually adjust the parametes of any of the 12 data-sets individually.
I am in the process of updating the program to make it a bit more user-friendly (Jan 2024).

